
Is the Rochester NY Housing Market Slowing Down? August 2026 Numbers
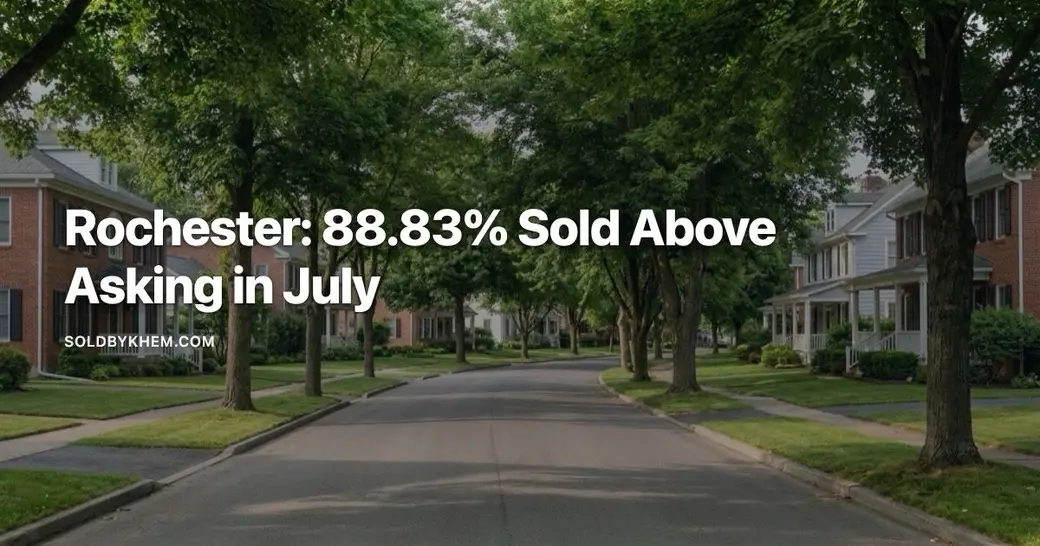
Why do Zillow, Redfin, Movoto and Houzeo all show different median home prices for Rochester NY?
They measure different things over different periods. For July 2026 Movoto reported a $199,000 median sale price inside Rochester city limits and Houzeo reported $230,000 up 17.95% year over year, while Zillow's city figure of $252,192 up 4.3% is an average valuation index rather than closed sales, and Zillow's $285,439 up 4.1% covers all of Monroe County including higher priced towns like Pittsford and Brighton. Medians reflect the middle closed sale and shift with the mix of homes sold, while averages run higher because of expensive outliers. All four sources do agree on direction: prices are up year over year, somewhere between about 4% and 18%.
If you have been reading about the Rochester NY housing market this summer, you have probably seen two stories at once. One says prices are climbing fast and there is nothing to buy. The other says things are calming down and buyers finally have room to breathe. Both of those stories are being published, in the same week, about the same county.
This post does three things. It shows you the verified numbers as of mid-August 2026, with the reporting period attached to each one. It explains exactly why four reputable sources publish four different median prices for "Rochester." And it tells you which figures I do not trust, and which ones I could not verify at all, so you can weigh them yourself.
I am not going to tell you the market is slowing when the data I can confirm does not show it.
What a slowing market would actually look like
Before looking at numbers, it helps to agree on what "slowing" means. In practice, a cooling market shows up in four places:
- Rates rising, pushing monthly payments up and buyers out
- Inventory building, so more homes sit available at any given moment
- Days on market stretching, because buyers have choices and take their time
- Prices flattening or falling year over year
You need most of those moving together to call it a shift. One number moving alone is usually noise, or a measurement difference. Let's go through them.
Mortgage rates are effectively flat year over year
This is the cleanest number in the whole discussion, because Freddie Mac publishes it weekly and everyone reports the same survey.
The 30-year fixed averaged 6.67% for the week ending August 13, 2026, per Freddie Mac's Primary Mortgage Market Survey. The prior week, ending August 6, it was 6.69%. A year earlier, in August 2025, it was 6.58%. The 15-year fixed was 5.96% for the week ending August 13, 2026, down from 6.01% the week before.
So rates are up roughly nine basis points from a year ago. That is functionally flat. Freddie Mac also noted that the August 13 reading ended a streak of five straight weekly increases, and chief economist Sam Khater described rates as relatively stable, with purchase and refinance applications rising as affordability improved slightly.
Why this matters: whatever has happened to Rochester NY home prices in 2026, you cannot blame or credit a rate change. Rates did not move enough to do it.
Here is one more thing worth knowing, because it explains a lot of the confusion. On August 13, two national outlets were still publishing 6.69% as the current rate. They were not wrong. They were reporting the August 6 survey. That is a one-week lag, not a contradiction. Almost every "the market is doing X" headline you read has a lag like that buried in it somewhere.
Four sources, four different Rochester prices
This is where readers get whipsawed. Below are the figures I verified, exactly as each source published them.
| Source | What it measures | Figure | Period |
|---|---|---|---|
| Movoto | Median sale price, city limits | $199,000 | July 2026 |
| Houzeo | Median sale price, city limits | $230,000, up 17.95% year over year | July 2026 |
| Zillow | Average home value index, city | $252,192, up 4.3% year over year | Page updated June 30, 2026 |
| Zillow | Home value index, Monroe County | $285,439, up 4.1% year over year | Updated April 30, 2026 |
The spread between the low and high figure is about $86,000 for overlapping geography and near-identical timeframes. Do not average them. Understand them instead:
- Movoto and Houzeo report median closed sale prices inside Rochester city limits. A median is the middle sale. It moves when the mix of what sold changes, not just when values change.
- Zillow's city figure is an average valuation index, a model estimate across all homes, not a record of what closed. Averages sit higher than medians when there are expensive outliers.
- Zillow's county figure covers all of Monroe County, which folds in Pittsford, Brighton, Mendon and the rest of the higher-priced southeast towns.
That last line is the one that matters most for my clients. A citywide Rochester median does not describe Pittsford, Brighton, or Honeoye Falls. If you live in one of those towns and you are using a citywide number to price your house, you are working from the wrong data set entirely.
One consistent signal cuts through all of it: every source shows prices up year over year. The direction agrees. Only the magnitude is in dispute, and the range is wide, from about 4% to nearly 18%.
The 51 day figure that does not hold up
Here is my favorite example of why aggregator stats mislead people.
Houzeo's July 2026 Rochester page reports homes selling at 120.57% of asking price and a median of 51 days on market, on the same page, for the same month. Those two things cannot both be true in the same market. Homes that sell 20% over ask do not sit for seven weeks.
Now compare the pace figures across sources:
- Movoto: 13 days average, July 2026, and 13 days a year earlier
- Zillow: about 8 days to pending, Monroe County
- Redfin, Northwest Rochester: about 11 days to sell
- Houzeo: 51 days, July 2026
Three sources cluster between 8 and 13 days. One is roughly four times higher. When a stat like the 51 day figure gets picked up and repeated, it becomes a headline about a cooling market. It is a measurement problem, not a market shift.
The same trap shows up in sales volume. Houzeo reports 509 city sales in July 2026 and calls it a 78.6% increase. Movoto reports 643 sales in July 2026 "up from" 707 a year earlier, which is a decline, not an increase. Those numbers contradict each other and one of them contradicts itself. I am not publishing either as fact.
Redfin's Northwest Rochester page is another useful lesson. It shows a $146,000 median over a trailing three-month window, up 4.3%, alongside a $183,000 average for a single month, up 25.8%, on the same screen. Two very different sounding answers, one page, because one is a three-month median and the other is a one-month average.
Monroe County housing inventory is the real story
Houzeo's July 2026 Rochester page reports 0.33 months of supply. I confirmed that figure directly.
By industry convention, a balanced market runs roughly five to six months of supply. That benchmark is a convention, not a published statistic, so treat it as a rule of thumb. But even generously, 0.33 months is a fraction of balanced. It means that at the current pace of sales, the available homes would be gone in about ten days.
I want to be straight with you about the limits here. I could not verify a current Monroe County active listing count or a county-level months of supply figure for July 2026. The federal data series that tracks Monroe County active listings and median days on market were lagging to earlier in 2026 when I checked. So the tightest, most authoritative inventory picture for the southeast towns is not something I can hand you from a public webpage today. It comes from pulling the local MLS, which I do by town.
So, buyers market or sellers market?
On the verified record, this is a sellers market and it is not close. Supply near a third of a month, homes going pending in eight to thirteen days by three separate sources, prices up year over year in every source, and mortgage rates essentially unchanged from last August. None of those four indicators points toward a slowdown.
Forward-looking context, for what it is worth: in December 2025, Realtor.com ranked Rochester the number two top U.S. housing market for 2026, forecasting 5.3% sales growth and a 10.3% median sale price increase, with a Rochester median list price of $256,900 against a national median near $415,000. That same analysis put new construction at only 6.8% of Rochester listings. A forecast is not a fact, but it tells you why the affordability story keeps drawing buyers here, and why so little new supply is arriving to relieve the pressure.
What I will not tell you
I do not have verified July 2026 medians, days on market, or inventory for Henrietta, West Henrietta, Pittsford, Brighton, Mendon, Rush, or Honeoye Falls. I also do not have verified figures for the nearby Finger Lakes towns. Those are the places I work, and I am not going to estimate them from a citywide Rochester number that describes a different housing stock at a different price point.
What I do instead comes from years of reading comps on the investor side, before I was licensed. For a listing appointment or a buyer consult, I pull the actual MLS activity for your town and your price band, then walk the recent comparable sales with you. Not a national index. Not a modeled valuation. The houses that closed near yours, and what condition they were in when they sold.
If you are trying to decide whether to list this fall or wait, or whether to keep competing as a buyer in a market this tight, bring me the headline that confused you. I will show you what is behind it, and what your specific street looks like.
Schedule a time to talk with Khem Kadariya and we will go through your numbers together.
About this data
The figures in this post were compiled from publicly available sources including Houzeo, Movoto, Redfin, RochesterFirst and Zillow, along with other public market data. Real estate numbers change quickly, and these were accurate as of August 2026. For current figures on a specific home, street, or town, ask me directly rather than relying on a published average.
Keep reading
Need Help With Financing?
Thinking about buying a home and wondering what financing options may be available to you?
I recommend connecting with my preferred lending partner, Brian Haefner with Premium Mortgage Corporation. Whether you are a first-time homebuyer, relocating to the Rochester area, purchasing your next home, or simply want to understand your mortgage options and buying power, Brian can help you explore your financing options and answer your mortgage-related questions.
Stay Connected With Khem
Looking for more Rochester real estate information, community updates and local insight?
- current Rochester market numbers
- search Rochester homes for sale
- see more Rochester content on Instagram
Want to know what these numbers mean for your own move? contact Khem and we can look at your situation specifically.
Recent Posts





Khem Kadariya
Phone