
Is the Rochester Market Slowing Down? Reading the May 2026 Monroe
What was the median home sale price in Monroe County NY in May 2026?
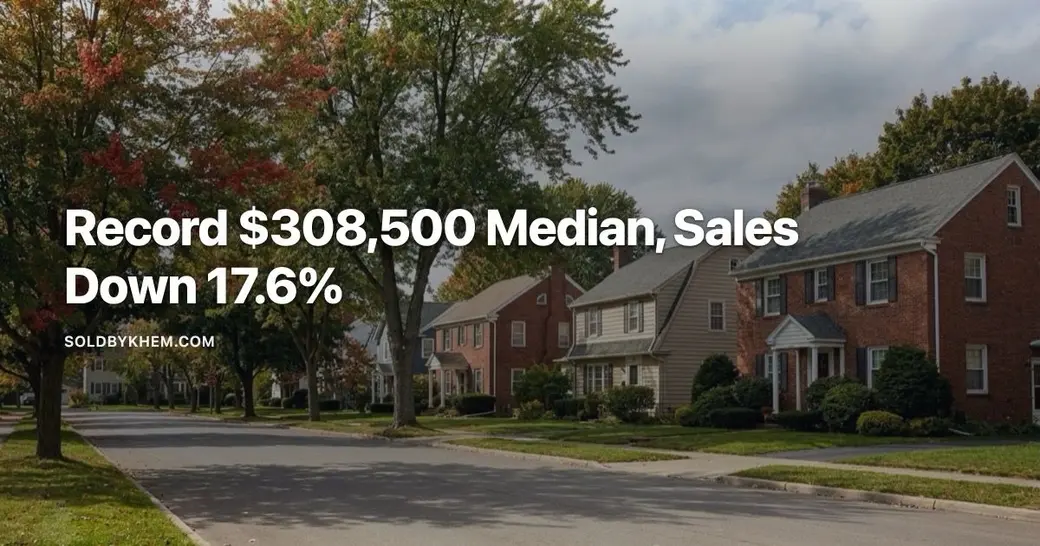
The median sale price in Monroe County was $308,500 in May 2026, a record high and up 7.9% from $286,000 in May 2025. The previous county record was $300,000, set in June 2025. At the same time, closed sales fell 17.6% to 512, while new listings were essentially flat at 844 versus 853 a year earlier.
If you have been reading Rochester real estate headlines, you have probably seen two opposite stories in the same week. One says the market is cooling. Another says prices are at record highs. Both are describing the same set of numbers.
This post walks through the most recent verified county data line by line: what went up, what went down, which figures floating around online should not be trusted, and what all of it means if you are thinking about buying or selling in Henrietta, West Henrietta, Pittsford, Brighton, Mendon, Rush or Honeoye Falls. I will also tell you plainly where the data runs out, because that matters as much as what it says.
What did the May 2026 Monroe County numbers actually show?
The most authoritative figures I have for Monroe County come from NYSAR, reported by the Rochester Business Journal and WHEC on June 26, 2026, covering May 2026.
| Measure | May 2026 | Change vs May 2025 |
|---|---|---|
| Median sale price, Monroe County | $308,500 (record high) | Up 7.9% from $286,000 |
| Closed sales | 512 | Down 17.6% |
| New listings | 844 | Essentially flat, from 853 |
The prior county record for median sale price was $300,000, set in June 2025. So May 2026 broke it.
Read those three rows together and the contradiction resolves itself. Fewer homes changed hands. The homes that did sell went for more money. Sellers did not flood the market with new inventory. That is not a cooling market. It is a market with a supply problem.
Do fewer closed sales mean Rochester NY prices are falling?
Closed sales count transactions. That number can fall for reasons that have nothing to do with demand weakening.
- Not enough homes listed. New listings were flat at 844 in May 2026 versus 853 in May 2025. If the same modest number of homes comes to market, there is a ceiling on how many can close, no matter how many buyers are looking.
- Buyers priced out rather than opted out. A buyer who wanted a house and could not win one is still demand. They just are not in the closed sales column.
- Fewer sellers moving. Every homeowner who stays put is one less listing and, usually, one less purchase on the other end.
If demand were genuinely falling away, you would expect the median sale price to flatten or slip. Instead it set a record and rose 7.9% year over year. That is the tell.
What do two more Monroe County figures show, with caveats?
A couple of other numbers get quoted for Monroe County. They are not wrong, but they measure different things and get mixed up constantly.
- Median listing price: $319,900 for May 2026, per FRED using Realtor.com data, released June 4, 2026. This is what sellers are asking, not what buyers are paying. Asking prices and sale prices move together but they are not interchangeable.
- Zillow's average home value for Monroe County: $285,439, up 4.1% over the past year. Zillow's figure is an estimated value across all homes, not a sale price, and the page I pulled it from carried no month stamp. Treat the reporting period as unknown.
Notice that NYSAR shows the median sale price up 7.9% while Zillow shows values up 4.1%. Different methods, different answers. Neither is lying. When someone quotes you a single number without saying what it measures or when it was measured, that is your cue to ask.
Is the city of Rochester a separate market from Monroe County?
Headlines often blur the city and the county. They are not the same market and the price levels are far apart.
- Per the Rochester Beacon on July 9, 2026, citing GRAR, the city median sale price was $181,000 at the close of Q2 2026.
- The same piece reports the city median rose from roughly $102,000 in 2018 to $148,000 in 2024, an increase of about 45%.
- Census Bureau data cited by the Beacon shows 50.9% of Rochester renters were cost-burdened in 2024, compared with 24.7% of homeowners. Both figures have declined since 2015.
If you are selling in Pittsford or buying in Honeoye Falls, the $181,000 city median tells you nothing about your transaction. It is a real number for a different market.
Which Monroe County real estate numbers should you ignore?
This is the part most market updates skip. When I went looking to confirm figures I had seen circulating, several of them fell apart.
The "169 homes for sale, 0.33 months of supply" figure
An aggregator site does publish this for July 2026. Here is the problem. GRAR counted roughly 1,400 active listings across the region at the end of June 2025, per Sharon Quataert Realty on December 10, 2025. A count of 169 cannot describe Monroe County. It is a narrow subset of one data feed. The 0.33 months of supply figure is arithmetic on a denominator that does not match this market, and comparing it to a balanced benchmark of five or six months would give you a badly wrong picture of what your house will do in Brighton or Mendon.
The "new listings down 43.87%" figure
I could not find it anywhere. What that same aggregator page actually says is that inventory fell 28.09% year over year, which is a different measure. And NYSAR shows Monroe County new listings essentially flat in May 2026. I am not going to repeat a number I cannot source.
The "sold at 120.57% of asking" figure
Same aggregator, July 2026. It also lists a median of 51 days on market on the same page, then explains in its own text that 45 to 70 days indicates a balanced market. A market averaging more than 20% over list price does not sit at 51 days. Genuinely competitive markets run around 100% to 105% of list. That page also shows a median price of $230,000, up 17.95%, which cannot be reconciled with NYSAR's $308,500 at plus 7.9% or Zillow's plus 4.1%.
The wrong Monroe County
Search for Monroe County real estate data and you will land on pages reporting median days on market of 38 and list-to-sale ratios around 98%. Some of those pages are about Monroe County, Pennsylvania, near Stroudsburg. Different state, different market, useless here. One national data site shows a Monroe County NY median of $247,651 next to a statement that the percentage of properties for sale is "12181.00%," with no reporting period given. That is broken output, not information.
What Monroe County data do I not have?
Being straight with you means naming the gaps.
- No town-level figures for Henrietta, West Henrietta, Pittsford, Brighton, Mendon, Rush or Honeoye Falls from any public source I checked. One site noted only that Pittsford carries the county's highest median list price, with no value and no period attached.
- No verified days on market for Monroe County in any 2026 month.
- No verified months of supply for Monroe County from NYSAR or GRAR.
- No 2026 active listing count for the county. The only figure I could confirm is that regional figure of about 1,400 at the end of June 2025.
- No Ontario or Livingston County figures, so nothing reliable for the nearby Finger Lakes towns.
For submarket questions, I work from actual comparable sales in the MLS rather than published summaries. That is a conversation, not a chart, because in these towns a street and a school district line can move a value more than a countywide average ever will.
What does the May 2026 Monroe County data mean for sellers?
Median sale price at a record $308,500 in May 2026, up 7.9%, with new listings flat, says pricing power is still on your side. The 17.6% drop in closed sales does not change that, because it reflects how few homes came to market, not buyers walking away.
It does mean fewer comparable sales to price against. With 512 closings countywide in May 2026, some price bands in some towns had very thin recent activity. Thin comps make overpricing easier and correcting it slower.
What does the May 2026 Monroe County data mean for buyers?
The 17.6% sales drop is not your opening. Flat new listings and a record median mean competition is still concentrated on whatever comes to market. Getting your financing squared away before you tour matters more than watching for a headline about a slowdown.
One more thing to verify yourself: mortgage rates. I saw a figure circulating for August 2026 that I could not confirm, so I am not printing it. Freddie Mac publishes the weekly average at freddiemac.com/pmms. Go read it there.
Talk it through with someone who has walked these houses
County medians are a starting point. Your house, your street and your timeline are the actual question. If you want to see what recent comparable sales say about your address in Henrietta, Pittsford, Brighton, Mendon, Rush or Honeoye Falls, and hear exactly where the numbers are solid and where they are thin, reach out.
Schedule a time with Khem Kadariya and bring your questions. I will show you the data I am working from.
About this data
The figures in this post were compiled from publicly available sources including Houzeo, Movoto, Redfin, RochesterFirst and Zillow, along with other public market data. Real estate numbers change quickly, and these were accurate as of August 2026. For current figures on a specific home, street, or town, ask me directly rather than relying on a published average.
Keep reading
Need Help With Financing?
Thinking about buying a home and wondering what financing options may be available to you?
I recommend connecting with my preferred lending partner, Brian Haefner with Premium Mortgage Corporation. Whether you are a first-time homebuyer, relocating to the Rochester area, purchasing your next home, or simply want to understand your mortgage options and buying power, Brian can help you explore your financing options and answer your mortgage-related questions.
Stay Connected With Khem
Looking for more Rochester real estate information, community updates and local insight?
Want to know what these numbers mean for your own move? contact Khem and we can look at your situation specifically.
Recent Posts

Khem Kadariya
Phone