
Rochester Housing Data: City, County or Metro?
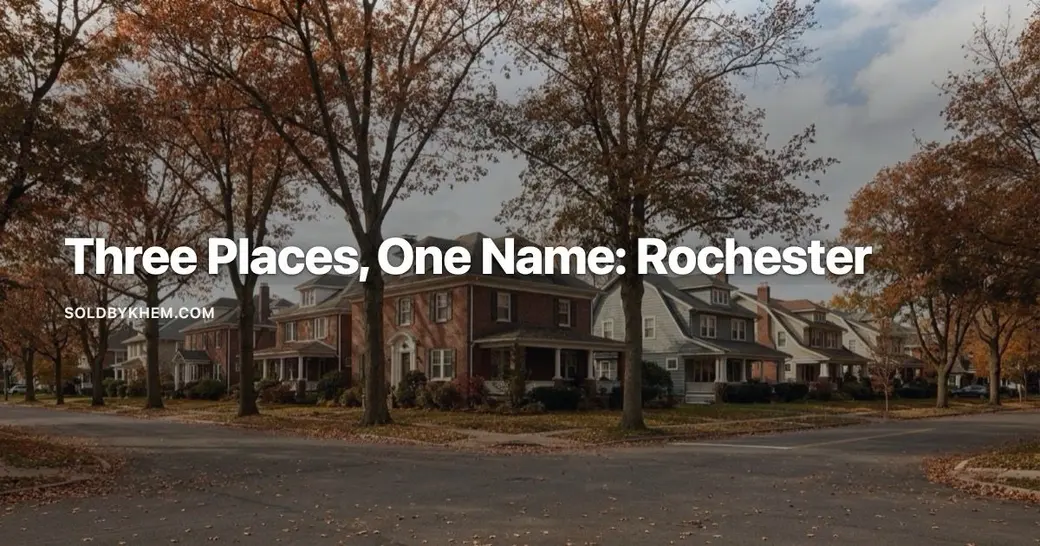
Why do Rochester NY housing reports show different median prices and inventory numbers?
Because "Rochester" can mean three different places: the City of Rochester alone, Monroe County (the city plus towns like Pittsford, Brighton and Henrietta), or the federally defined metro area, which adds several neighboring counties reaching into the Finger Lakes. A metro-wide median can undershoot the higher-priced towns because rural counties pull it down, while a county median blends dense city blocks and open acreage and may miss any single town in either direction. Most reports disagree because each is drawing a different boundary, so check which geography and reporting period a figure covers before comparing.
If you are researching a move from out of state, you have probably collected a dozen browser tabs of Rochester housing numbers by now. One says inventory is nearly nonexistent. Another says buyers finally have breathing room. A third quotes a median price that does not match either of the first two. It is tempting to assume somebody is wrong or spinning.
Usually nobody is wrong. They are describing different places and calling all of them Rochester.
This post covers four things: the three geographies that share the name, why a missing geography label distorts the number that follows it, two specific metrics that break in predictable ways, and where to get figures that come with a place and a date attached. No market statistics in this one. I am not going to quote a median price I cannot source with its reporting period, and by the end you will see why that discipline matters more here than in most metros.
What does "Rochester NY" mean: city, county or metro?
When a national site publishes something about Rochester, it is almost always reporting one of these three, and it does not always tell you which.
| Label | What it actually covers | Who reports on it |
|---|---|---|
| City of Rochester | The municipal boundary only. Neighborhoods like the South Wedge, Park Avenue, Charlotte, the 19th Ward. Excludes every suburb. | National aggregators, city-level news coverage |
| Monroe County | The city plus all the surrounding towns and villages: Henrietta, West Henrietta, Pittsford, Brighton, Mendon, Rush, Honeoye Falls, and the rest. | State and local Realtor associations, county records |
| Rochester metro area | Monroe County plus several neighboring counties, as the federal statistical definition currently draws it. Reaches well out into the Finger Lakes. | Federal labor and census data, some national real estate reports |
These are not slight variations on a theme. City of Rochester home prices and suburban Monroe County town prices are separate housing markets with separate inventory, separate typical lot sizes, separate school districts, separate tax bills. Averaging them together produces a real number that describes no actual place you can buy a house in.
So when you compare two Rochester versus Monroe County housing data points and they disagree, the first question is never "which one is lying." It is "which boundary is each one drawing."
Why do Rochester NY home price reports disagree so much?
Some metros are geographically uniform enough that city and county numbers land in roughly the same neighborhood. Greater Rochester is not one of those. The county contains dense city blocks, postwar suburban tracts, village centers with sidewalks and walkable main streets, and open acreage on the southern edge toward Mendon and Rush. Housing stock ranges from small city doubles to nineteenth century farmhouses to subdivisions built in the last five years.
That spread has consequences for anyone relocating to Rochester NY and trying to budget:
- A metro-wide median can undershoot what you will pay in the higher-priced towns, because it is pulled down by the wider, more rural counties in the definition.
- A county-wide median can overshoot or undershoot a specific town badly, in either direction, because it blends the whole range.
- A city figure tells you nothing about the suburbs, and vice versa. They are frequently moving on different timelines.
None of this makes any single number bad. A county median is genuinely useful for tracking direction over time. It is just not a house-shopping budget for Pittsford or Honeoye Falls.
What does months of supply really mean in Rochester NY?
Months of supply is the metric most often broken by a geography mismatch, and you can catch the break with arithmetic alone.
The formula is simple: active listings divided by closed sales per month. If a market has 600 homes for sale and closes 300 a month, that is two months of supply. Five to six months is the usual rule of thumb for a balanced market, though that benchmark is a convention rather than a law.
Now run it backward on a number you see published. Say a site reports 200 homes for sale and inventory of one third of a month. That implies about 600 closed sales every month, or over 7,000 a year, in whatever area those 200 listings came from. If the listing count was scoped to the city and the sales count was scoped to the county, you get exactly that kind of impossible-looking result. The math is fine. The inputs came from two different maps.
Practical rule: whenever a months-of-supply figure looks extreme in either direction, multiply it back out and ask whether that sales pace is plausible for the area named. Extremely low supply readings are often a symptom of an undercounted listing feed or mismatched geographies rather than a genuinely frantic market.
Days on market vs days to close: which does Rochester NY use?
Here is the second one that trips up out-of-state readers, and it is a definition problem rather than a geography problem.
Some sources report days from listing to accepted contract. That is true market exposure: how long the home sat before someone committed. Others report days from listing to closing, which bundles in the entire financing and title period, commonly another 30 to 45 days.
Those two figures can differ by a factor of four for the same house. So if you find a report showing homes selling above asking price while also showing a long median days on market, you have not found a contradiction. You have probably found a list-to-close figure sitting next to a list-to-contract statistic. Before you conclude anything about negotiating leverage, check the site's methodology page for which clock it starts and stops.
Are town-level Rochester NY housing numbers too small to trust?
You want Pittsford. Or Brighton. Or Henrietta. Fair enough: that is the level at which you actually choose a school district and a commute. Town data does exist, and the local MLS is where it lives.
The catch is sample size. A single town in south and southeast Monroe County may close a modest number of homes in a given month. When the denominator is that small, one unusual sale can move a monthly median noticeably, and the swing means nothing about the market. That is why serious town-level reporting uses rolling three-month or twelve-month windows and labels them as such.
Two habits worth adopting:
- Prefer a rolling window over a single month for any individual town, and check that the source says which it used.
- Do not accept a county figure as a substitute for a town figure. If town data is unavailable for the metric you want, the honest answer is that it is unavailable, not that Monroe County's number will do.
Which Rochester NY housing data sources cover which area?
Some sources publish geography and reporting period as a matter of course. Those are the ones to anchor on:
- The New York State Association of Realtors for monthly county-level figures, including median sale price, closed sales and inventory for Monroe County.
- The Greater Rochester Association of Realtors for local MLS statistics, and the most likely place to find town-level detail for Pittsford, Brighton, Henrietta, Mendon, Rush and Honeoye Falls.
- Freddie Mac's Primary Mortgage Market Survey for the weekly national average mortgage rate, which is national by design and should never be described as a Rochester number.
- The Bureau of Labor Statistics for Rochester metro area employment, which is genuinely a metro-level statistic and correctly labeled as one.
National aggregators still have their uses, especially for spotting a trend quickly. Treat them as secondary. Where they disagree with the state or local Realtor data, lead with the Realtor data and note the gap rather than picking whichever number you prefer.
Three questions to ask about any Rochester NY housing number
Before I repeat a figure to a client, it has to survive this:
- What geography? City, county, metro, or a single town. If the source will not say, the number is decoration.
- What period? A named month, quarter, or rolling window. Also whether that period has actually closed. Monthly MLS reports typically publish one to two weeks after month-end, so a figure for the current month does not exist yet.
- What definition? Especially for days on market and for anything involving a listing count.
Anything that fails one of those three, I say so plainly instead of dressing it up. I spent years buying, renovating and reselling houses in this area before I was licensed, and the fastest way to lose money in that work is to act on a number whose source you never checked. The habit carried over.
If you are planning a move into Monroe County from out of state and want figures for a specific town with the geography, period and definition spelled out, I will pull them and walk you through what they do and do not tell you. Book a time with me here and bring the tabs you have already collected. Sorting out what each one is measuring is usually the most useful hour of the whole search.
Khem Kadariya
About this data
The figures in this post were compiled from publicly available sources including Houzeo, Zillow, RochesterFirst, Movoto and Redfin, along with other public market data. Real estate numbers change quickly, and these were accurate as of August 2026. For current figures on a specific home, street, or town, ask me directly rather than relying on a published average.
Keep reading
Need Help With Financing?
Thinking about buying a home and wondering what financing options may be available to you?
I recommend connecting with my preferred lending partner, Brian Haefner with Premium Mortgage Corporation. Whether you are a first-time homebuyer, relocating to the Rochester area, purchasing your next home, or simply want to understand your mortgage options and buying power, Brian can help you explore your financing options and answer your mortgage-related questions.
Stay Connected With Khem
Looking for more Rochester real estate information, community updates and local insight?
Have a question about Rochester real estate? contact Khem and we can talk it through.
Recent Posts







Khem Kadariya
Phone