
Is Pittsford a Buyer's Market or a Seller's Market Right Now?
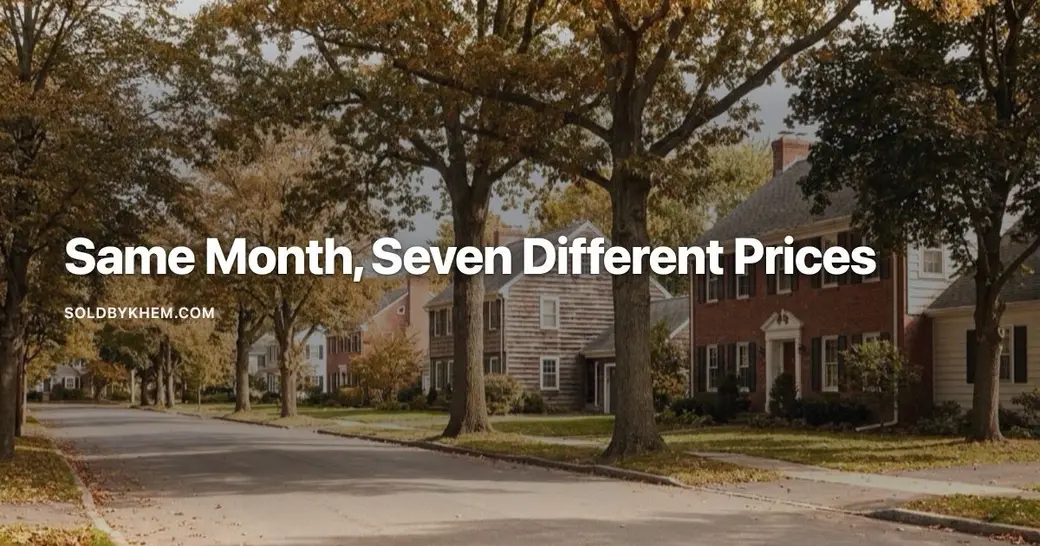
How can you tell if Pittsford NY favors buyers or sellers?
If you are trying to decide whether to list your Pittsford house this fall or wait, you have probably typed some version of Pittsford NY buyers market or sellers market into a search bar and gotten a confident answer. I want to show you why those answers are not trustworthy, using the actual figures the aggregator sites were publishing this summer.
Here is what you will get from this post: the range of published prices for the Rochester market and why they disagree by more than sixty percent, why a city of Rochester statistic cannot describe a Pittsford or Mendon closing, where the pace numbers contradict each other, and what I actually pull before advising anyone to list or offer. I will also be direct about what I do not have. There is no town level figure in this post, because I will not publish one I cannot source.
How far behind is Pittsford NY home sale data?
As I write this in mid August 2026, no August closings exist yet. They get reported in early to mid September. The freshest local sales data available is July 2026 from the aggregator sites, and May 2026 from the New York State Association of Realtors figures reported by the Rochester Business Journal. The only genuinely current number is the mortgage rate.
Anyone telling you what the market is doing "right now" is telling you what it did four to twelve weeks ago. That is not a criticism. It is just how closings work. But it matters when you are timing a move.
Why do Pittsford NY median prices differ by source?
These are all published figures for the Rochester market, gathered on the same day.
| Source | Figure | Geography | Reporting period |
|---|---|---|---|
| Movoto | $199,000 median sale price | "Rochester" | July 2026 |
| Houzeo | $230,000 median sale price, up 17.95% year over year | "Rochester" | July 2026 |
| Zillow | $252,192 average home value, up 4.3% year over year | City of Rochester | Page dated June 30, 2026 |
| Resideline | $255,000 median sold price | "Rochester" | July 2026 |
| Zillow | $285,439 average home value, up 4.1% year over year | Monroe County | Updated April 30, 2026 |
| NYSAR, via Rochester Business Journal | $308,500 median sale price, a new high | Monroe County | May 2026 |
| Realtor.com, via FRED | $319,900 median listing price | Monroe County | May 2026 |
That is a spread from $199,000 to $319,900, a gap of roughly 61 percent, for what is presented as the same market at roughly the same moment.
The gap is not mostly measurement error. It is a definition problem. Some sources mean the city of Rochester. Some mean Monroe County. One reports a median sale price, another a median list price, and Zillow's "average home value" is a modeled index rather than an average of closings. Stack them on one page and you get nonsense.
Do Monroe County stats describe Pittsford homes?
The strongest single figure in that table is the NYSAR median of $308,500 for Monroe County in May 2026, because it comes from board of Realtors data reported by a local business publication rather than a scraped estimate. It is still the wrong tool for your decision.
Monroe County includes the city, the inner ring, and the towns. A county median blends all of it into one number that describes no actual neighborhood. If you own a four bedroom colonial off Mendon Road, the county median tells you nothing useful about what your buyer pool looks like. Neither does a city of Rochester months of supply figure.
This is the whole argument for town level real estate data Monroe County sellers should be asking for by name. The Mendon NY housing market and the Brighton market can move in different directions in the same quarter, and both can diverge from the county line. Small towns make this harder, not easier. Rush NY home values in particular rest on a thin number of annual closings, which means one unusual sale can drag a median around. That is a reason to widen the time window and read the individual comps, not a reason to fall back on a county average.
How fast do Pittsford NY homes actually sell?
Speed of sale is usually a cleaner signal than price. Here is what the sources said.
- Zillow: homes going pending in around 8 days, Monroe County, as of April 30, 2026.
- Movoto: 13 average days on market in July 2026, compared with 13 days a year earlier.
- Redfin: 11 days on market for a northwest Rochester neighborhood over the three months ending May 2026, compared with 11 days a year earlier.
- Houzeo: 51 days on market, July 2026.
Three sources cluster between 8 and 13 days. One says 51. And Houzeo's own page reports 0.33 months of supply for July 2026, which works out to about 10 days of inventory. A market with ten days of supply does not take 51 days to sell a house.
It gets worse. Houzeo publishes its own interpretation rule: under 45 days signals a seller's market, 45 to 70 days is balanced, over 70 favors buyers. By that rule, its own 51 day figure classifies Rochester as balanced while the rest of the page calls it a strong seller's market. Treat 8 to 13 days as the credible range.
Two more things I will not repeat as fact. Houzeo's reported sale to list ratio of 120.57 percent for July 2026 is single sourced and extraordinary, so I flag it rather than lean on it. And the sales volume figures are broken: Houzeo reports 509 sales in July 2026, up 78.6 percent year over year, while Movoto reports 643 sales and describes that as up from 707 the year before, which is a decline of about 9 percent, not an increase.
Is the Rochester NY housing market really cooling?
Mid year 2026 coverage described a national market unwinding from the pandemic frenzy, with buyers seeing more choice than at the start of the year and modest price growth. Read further into the same coverage and the split is explicit: many Sun Belt cities cooled and listings sat for months, while parts of the Midwest, Northeast and Bay Area got hotter and more expensive as buyers competed over shrinking inventory.
So the cooling story is largely a Sun Belt story. Some of the softening language attached to Rochester specific pages, including Redfin syndicated content from April and May 2026 describing a slow market and an early stage gradual reset, comes from national models applied to a local page. Meanwhile Redfin scored one northwest Rochester neighborhood 92 out of 100 for competitiveness. That is neighborhood level only, but it does not read like a slowdown.
Direction is genuinely contested locally too. A Rochester Business Journal headline in June 2026 read that housing inventory was on the rise in Monroe County, but so were prices. Other summaries circulating claimed sharp declines in new listings. I could not verify those decline figures, so I am not printing them.
Are mortgage rates driving Pittsford home prices?
Freddie Mac put the 30 year fixed at 6.67 percent for the week of August 13, 2026, down from 6.69 percent the prior week and up from 6.58 percent a year earlier. The 15 year averaged 5.96 percent, against 5.71 percent a year ago.
That is nine basis points of movement on the 30 year over twelve months. On a $300,000 loan it is somewhere around $18 a month. If your local price picture changed materially this year, rates are not the reason.
What data should I check before buying on my Pittsford street?
The honest version of this analysis is not a headline. It is a query.
- Closed sales by town, not county, for the last six to twelve months, so the sample is large enough to mean something in Mendon, Rush or Honeoye Falls.
- The same closings split by price band. A $325,000 ranch and an $850,000 colonial in the same town are not in the same market.
- Days from list to accepted offer for those closings, plus the count of price reductions along the way.
- Sale price against original list price, not against the last reduced list price.
- Active and pending counts in that town and band, which is what actually produces a months of supply figure you can trust.
- Style and condition matches. I have walked enough of these houses to know a 1960s Brighton split and a newer Pittsford build are not comps just because the square footage matches.
Run that, and the buyer or seller question usually answers itself for your specific band. Sometimes the answer differs for the house you are selling and the house you are buying, which is the normal situation for a move up and worth planning around rather than ignoring.
If you want that pulled for your address, in writing, with the reporting period on every figure and the gaps stated plainly, book a time with me and we will go through it together.
Khem Kadariya
About this data
The figures in this post were compiled from publicly available sources including Houzeo, Movoto, Redfin, Zillow and FRED (Federal Reserve Bank of St. Louis), along with other public market data. Real estate numbers change quickly, and these were accurate as of August 2026. For current figures on a specific home, street, or town, ask me directly rather than relying on a published average.
Keep reading
Buying After You Sell?
If your move involves buying as well as selling, the financing side is worth lining up early.
I recommend connecting with my preferred lending partner, Brian Haefner with Premium Mortgage Corporation.
Stay Connected With Khem
Looking for more Rochester real estate information, community updates and local insight?
Thinking about selling in Greater Rochester? talk with Khem for a conversation about pricing, preparation and current buyer demand.
Recent Posts





Khem Kadariya
Phone