
Will Rochester Home Prices Drop? Four Things to Watch
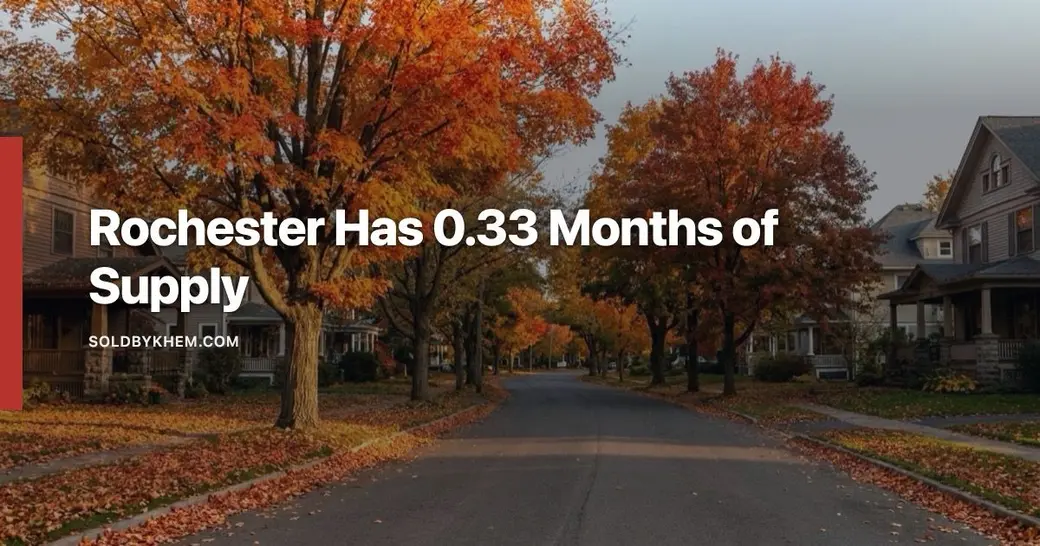
Will home prices drop in Rochester NY?
Not on the current supply picture. Rochester had 0.33 months of supply in July 2026 according to Houzeo, against the five to six months the industry treats as balanced. Prices fall when listings outnumber buyers for months at a time. Nothing in the data I could verify shows Rochester inventory improving.
If you are about to buy in Monroe County, or you already own here and keep reading that the market is cracking, this post is for you. I am going to lay out the four specific things that would have to change before home prices in the Rochester area actually fall. I will show you where each one stands today, name the reporting period for every number, and tell you plainly where the data does not exist. Some of what you have read online is not wrong so much as it is measuring a different thing.
Why do the housing headlines contradict each other?
Because the sites publishing them are counting different houses, in different months, using different metrics. Here are three sources describing roughly the same market at roughly the same time.
| Source and period | Median sale price | Days on market | Homes sold |
|---|---|---|---|
| Houzeo, City of Rochester, July 2026 | $230,000, up 17.95% year over year | 51 | 509, up 78.6% year over year |
| Movoto, Rochester, July 2026 | $199,000 | 13 | 643, which its own page describes as down from 707 a year earlier |
| Redfin, Northwest Rochester neighborhood, three months ending May 2026 | $146,000, up 4.3% year over year | 11 | 106 in May, versus 141 a year earlier |
Same city, same summer. A $31,000 gap in the median. Fifty-one days versus thirteen. Sales up 78.6% in one source and down in another. The Redfin line is a single neighborhood, not the city, and I am labeling it that way on purpose because plenty of articles do not.
Three metric families get mixed together constantly, and once you separate them most of the confusion disappears:
- Closed sale medians, which report what actually changed hands, one to two months after the fact.
- List price medians, which report what sellers are asking. Monroe County's median listing price was $319,900 in May 2026, per Realtor.com data published through FRED. That is not a sale price and cannot be compared to one.
- Automated value indices, like Zillow's ZHVI, which showed a Rochester average home value of $252,192, up 4.3% year over year, on a page dated June 30, 2026, and $285,439 for Monroe County, up 4.1%, on an undated page. Those are model outputs, not closings.
One more thing worth knowing. When Freddie Mac released its August 6, 2026 rate survey, its chief economist described the national housing market as showing signs of adjustment, with listing prices modestly below year-ago levels and for-sale inventory improving. That is a national statement. It is a fair description of a lot of the country. It is not what the Rochester numbers look like.
Change one: inventory would have to climb from 0.33 months toward five
Houzeo put Rochester at 0.33 months of supply in July 2026. The industry convention for a balanced market is five to six months. At a third of a month, every listing that is priced sensibly and shows well has more than one interested buyer waiting for it.
Prices do not fall because a headline says they should. They fall when there are more houses for sale than there are buyers, and that condition holds for months, not weeks. That means supply would have to multiply many times over. Not double. Multiply.
Be aware of a real data lag here. The Realtor.com county series carried through FRED run behind: median listing price through May 2026, median days on market through April 2026, and active listing count only through January 2026. There is no published August 2026 Monroe County inventory figure I could source. Anyone quoting you one should be able to say where it came from.
Change two: mortgage rates would have to break out of their band
They have not. Freddie Mac's 30-year fixed average read 6.46% in the week ending April 2, 2026, 6.69% in the week ending August 6, 6.67% in the week ending August 13, and 6.65% in the week ending August 20, 2026. The 15-year fixed was 5.95% that same week. That is a flat line with wiggle, not a shock.
Which matters for a simple reason: rates are not what is moving Rochester prices right now. A sharp rate spike could cool buyer demand. A sharp drop could pour more buyers into a market with a third of a month of supply, which does not help affordability either. What we have instead is a rate that has sat near six and a half percent all year while local prices kept moving.
A note on sourcing. I saw a widely shared article in July 2026 quoting a 30-year rate of 6.58% as an eleven-month high. That figure does not reconcile with Freddie Mac's own readings two weeks later, and the reasoning attached to it appeared to describe events from the prior year. I do not cite it and neither should anyone else. Freddie Mac publishes its survey weekly, for free.
Change three: local demand would have to weaken enough to leave houses sitting
This is the one I can least support with numbers, so I am going to say so. I have no verified 2026 employment, payroll or major-employer data for the Rochester area to put in front of you. What I can tell you is what a genuine demand shift looks like on the ground, because I would see it before any aggregator published it: open houses with four visitors instead of forty, listings going a second and third weekend without an offer, price reductions arriving in week two rather than week six, and buyers asking for repairs again instead of waiving them.
If you want a real forecast for the Rochester housing market, watch those behaviors. They lead the statistics by a month or two.
Change four: the way homes are being bid would have to change
Houzeo also published a sale-to-list ratio of 120.57% for Rochester in July 2026, alongside its 51-day median. I am not going to repeat that number as fact. A market where the typical home sells for a fifth over asking does not also take fifty-one days to sell. One of those two figures is wrong, and I cannot tell you which from the outside.
What I can tell you is that a falling market shows up in offer structure first. Escalation clauses stop appearing. Inspection contingencies come back. Appraisal gaps stop being asked for. Sellers start covering closing costs. None of that is in a monthly index, and all of it is visible from inside a transaction.
Is Rochester a housing bubble?
A bubble is a price level held up by easy credit and speculative building, with supply arriving behind it. What the Rochester data shows instead is a shortage: 0.33 months of supply in July 2026, and price gains in the mid single digits on Zillow's index, up 4.3% year over year for the city on a page dated June 30, 2026, and 4.1% for Monroe County. That is not the shape of a mania. It is the shape of not enough houses. A market like that can still be a bad deal for an individual buyer who overpays for a specific house with a bad roof. That is a different risk, and it is the one I can actually protect you from.
What about smaller towns like Honeoye Falls?
Village-level data is where the numbers get least reliable, and honesty is worth more here than filler. Homes.com lists a median sale price of $449,950 for Honeoye Falls with no reporting month attached, which makes it unusable by my own standard. Movoto published two different May 2026 median list prices for the same village on two of its own pages, $449,000 and $499,000, and two different list prices per square foot. Both cannot be right. Honeoye Falls is a village of a few thousand people in the Honeoye Falls-Lima Central School District, and its monthly median moves on a handful of closings.
Also watch the name. Search results routinely mix Honeoye Falls in Monroe County with Honeoye in Ontario County, on Honeoye Lake. Different towns, different school districts, different markets. I have seen buyers quote me numbers from the wrong one.
For Henrietta, West Henrietta, Pittsford, Brighton, Mendon and Rush, I do not have public monthly figures I would stand behind in writing. I do have MLS access, and I can pull actual closed sales on your street or in your school district and show you the sheet.
Common questions
Should I wait for prices to fall before buying in Monroe County?
Waiting is a bet that supply improves faster than prices rise. In July 2026 Rochester had 0.33 months of supply, against the five to six months treated as balanced, so that bet has a long way to run. The better question is whether a specific house at a specific price works for your budget at roughly 6.65%, the Freddie Mac 30-year average for the week ending August 20, 2026.
Which website has the correct Rochester median home price?
None of them, exactly. For July 2026, Houzeo published $230,000 and Movoto published $199,000 for the same city and month. They draw on different data feeds, cover slightly different geographies and update on different schedules. Use them for direction, not for pricing a house. For a specific address, use closed MLS comparables.
Would falling mortgage rates make homes cheaper here?
Not necessarily. Lower rates cut your monthly payment, but in a market with a third of a month of supply they also bring more buyers to the same listings. Rates have stayed in a narrow band all year, from 6.46% in early April 2026 to 6.65% on August 20, 2026, so this has not been tested locally.
What is the earliest sign that Rochester area prices are turning?
Offer structure and time on market, in that order. Inspection contingencies returning, appraisal gap requests disappearing, and listings needing a price cut in week two are all visible weeks before any published index reflects them. Rising active listing counts confirm it afterward.
Why do national headlines say the market is adjusting when Rochester is not?
Because national averages include regions where inventory really is building. Freddie Mac's August 6, 2026 release described exactly that at the national level, with listing prices modestly below year-ago levels. Rochester's supply picture does not match it. National housing news is a poor guide to a single county.
If you are trying to decide whether to buy now, hold, or list, I would rather show you the actual closings behind your decision than argue about aggregator averages. I have been in these houses and I will tell you what I saw in them. Book a time with me and bring your questions, including the skeptical ones.
Khem Kadariya
About this data
The figures in this post were compiled from publicly available sources including Redfin, Houzeo, Zillow, Movoto and FRED (Federal Reserve Bank of St. Louis), along with other public market data. Real estate numbers change quickly, and these were accurate as of August 2026. For current figures on a specific home, street, or town, ask me directly rather than relying on a published average.
Keep reading
Need Help With Financing?
Thinking about buying a home and wondering what financing options may be available to you? Knowing where you stand before you write an offer puts you in a much stronger position.
I recommend connecting with my preferred lending partner, Brian Haefner with Premium Mortgage Corporation. Whether you are a first-time homebuyer, relocating to the Rochester area, purchasing your next home, or simply want to understand your mortgage options and buying power, Brian can help you explore your financing options and answer your mortgage-related questions.
Stay Connected With Khem
Looking for more Rochester real estate information, community updates and local insight?
Want to know what these numbers mean for your own move? talk with Khem and we can look at your situation specifically.
Recent Posts






Khem Kadariya
Phone