
Rochester Ranked 10th of 235 US Markets for Price Growth
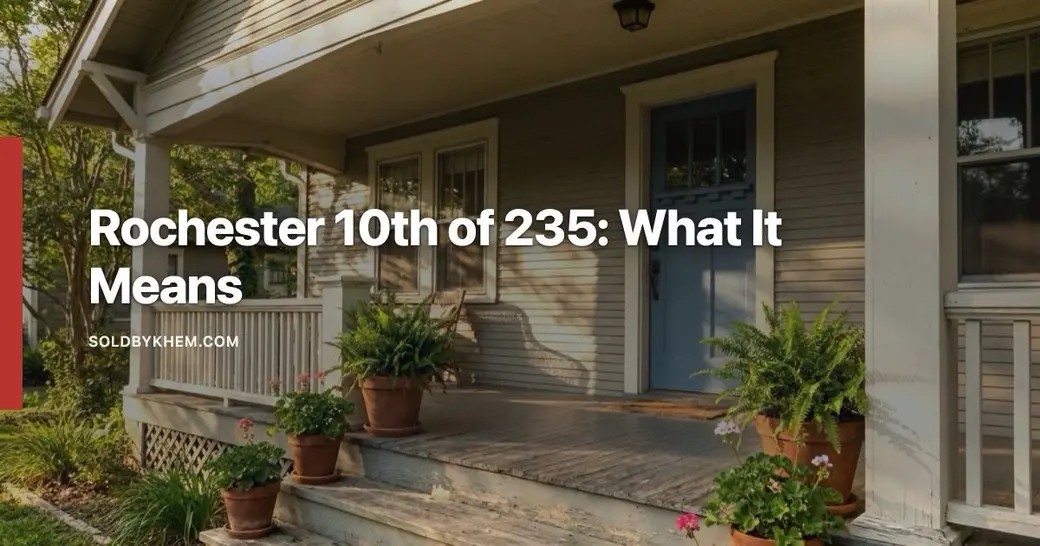
Is Rochester really one of the hottest housing markets in the US right now?
The Rochester metro ranked 10th out of the 235 largest US markets for price growth in the National Association of Realtors quarterly report, with a first quarter 2026 median sale price of $252,800, up 7.2% year over year. That ranking measures the rate of price change only, not affordability, inventory or how any single town is performing.
A national ranking landed in a lot of inboxes this year: the Rochester metro placed 10th out of the 235 largest US markets for price growth. Sellers read it as permission to price high. Buyers read it as a reason to panic. Both readings are wrong, and the reason is in the fine print of what the ranking actually measured.
Here is what the number is, where it came from, the three quarters of context that sit around it, and what a buyer or seller in Monroe County should genuinely do differently because of it.
What the Rochester housing market ranking actually says
The source is the National Association of Realtors quarterly metro price report, covered by the Rochester Business Journal on May 7, 2026. Two figures matter:
- The Rochester MSA median sales price in the first quarter of 2026 was $252,800.
- That was up 7.2% year over year, the 10th largest increase among the 235 largest US markets.
Read that second bullet slowly. The ranking is a ranking of change. It is not a ranking of price level, affordability, inventory, days on market, or anything a person would casually mean by "best market." A metro can rank high on price growth while remaining one of the cheaper metros in the country, and Rochester does exactly that. The same quarter that produced Rochester home prices up 7.2 percent produced a median well under half of what New York State as a whole was posting.
One more detail from that article, and it is the useful one: the first quarter is seasonally the weakest quarter for prices. Fewer homes trade, and the mix skews. A 7.2% gain recorded in the softest quarter of the year is more meaningful than the same gain recorded in June. It also means $252,800 is not the number to hold in your head for the rest of the year.
Does a top ten ranking mean prices here only go up?
No, and the same NAR series proves it. Look at the three quarters the Rochester Business Journal reported together:
| Period | Rochester MSA median sales price |
|---|---|
| Q2 2025 | $289,800 |
| Q3 2025 | $287,300 |
| Q1 2026 | $252,800 (up 7.2% year over year) |
The Q1 2026 figure is roughly $37,000 below the Q2 2025 figure. Nothing crashed. That is seasonality plus a shift in what sold. Winter closings in this county lean toward smaller homes and fewer of the higher priced Pittsford and Mendon properties that move in spring. If you compare a January closing to a June closing and call the difference a trend, you will make a bad decision.
The honest way to read the sequence: Monroe County price appreciation is real and it is running ahead of most of the country on a year over year basis, while the quarter to quarter line still zigzags the way it always has.
Why do the numbers you find online disagree so badly?
Because they measure different things, over different periods, and they update at wildly different speeds. This is the single most useful thing to understand before you argue with a listing agent about price. Four figures I can source, all describing roughly the same corner of the world:
| Figure | Period | What it actually measures |
|---|---|---|
| $252,800 median sale price, up 7.2% | Q1 2026 | Rochester metro, closed sales, NAR quarterly via RBJ |
| $319,900 median listing price | May 2026 | Monroe County, asking prices, Realtor.com series on FRED |
| $181,000 median sale price | Close of Q2 2026 | City of Rochester only, closed sales, GRAR via Rochester Beacon |
| $553,268 median sale price, up 7.4% | June 2026 | New York State, closed sales, Redfin |
None of those four contradict each other. A metro is not a county, a county is not the city, asking is not selling, and a quarter is not a month. But if you skim four websites in ten minutes you will come away convinced the local market is simultaneously $181,000 and $553,000.
It gets worse with the automated aggregator pages. One national site currently shows a Rochester sale to list ratio above 120% sitting next to a 51 day median time on market. Those two cannot both be true: a market clearing 20% over asking does not also take seven weeks to sell. Another site's page for Rush lists its "best neighborhoods" as Park Avenue, Corn Hill and the South Wedge, all of which are in the City of Rochester, several towns away. Treat those pages as advertising, not data.
What the ranking should change if you are buying
Very little about your search, and quite a lot about your timing assumptions. Concretely:
- Do not raise your offer because of a headline. A national ranking has no bearing on what the specific house you are standing in is worth. Closed sales of similar homes in the same town, same price band, last 90 days, do.
- Expect the appraisal to be the referee. If you are financing and you stretch past what recent comparable sales support, you cover the gap in cash. Rising prices do not change that math, they make it more common.
- Use the seasonal pattern. The first quarter is the weakest quarter for prices in this metro. Fewer listings, but also fewer competing buyers.
- Check the date on every statistic you are shown, including mine. A widely used site's page for Rush was, when I pulled it on August 27, 2026, reporting August 2025 figures under language that reads like last month.
What the ranking should change if you are selling
Do not price off a national list. Price off the last six comparable closings in your town and your price band, then decide how much of the current momentum you want to test.
There is a real counterweight worth knowing. Statewide in June 2026, Redfin recorded 10,253 homes sold, down 3.5% year over year, homes for sale up 2.7%, and a median 36 days on market, one day longer than the year before. Prices up, volume slightly down, inventory slightly up. That is a market with less urgency in it than a top ten growth ranking suggests, and buyers in Brighton and Henrietta are reading those same signals.
Small towns like Rush are too thin to rank at all
Rush is the clearest example of why town level statistics need a warning label. On August 27, 2026, there were four houses listed for sale in the town, ranging from $399,900 to $1,298,000. Homes.com reported a February 2026 median price of $294,450 against an average sale price of $385,761, with homes averaging 31 days listed. That $91,000 gap between median and average is the signature of a very small sample where one or two high end sales move everything.
With single digit monthly sales, a Rush percentage change tells you about two houses, not about a market. The same caution applies in Mendon and, in some months, West Henrietta. Ask for the actual list of comparable sales rather than a percentage.
The part the ranking leaves out entirely
Price growth is a good headline and an incomplete picture. Census Bureau data reported by the Rochester Beacon in July 2026 found 50.9% of Rochester renters were cost burdened in 2024 and 24.7% of homeowners, representing more than 38,000 households. Both figures improved from 2015, when they were 57.9% and 25.8%. And the City of Rochester median sale price climbed from roughly $102,000 in 2018 to $148,000 in 2024, a 45% increase, before reaching $181,000 at the close of Q2 2026.
So a Rochester real estate national ranking that celebrates fast appreciation is describing the same force that is squeezing the entry price band. If you are buying your first home here, that is the number that governs your life, not the ranking.
Common questions
What does 10th out of 235 markets actually measure?
It measures the percentage change in median sale price from one year earlier, for the Rochester metro area, in the first quarter of 2026. That gain was 7.2%, against a median sale price of $252,800. It says nothing about affordability, inventory levels, school districts, or how any individual town in Monroe County performed.
Should I wait for prices to drop in Rochester?
Nothing in the data I can source points to a decline. The most recent quarterly metro reading available was 7.2% growth year over year, and statewide prices in June 2026 were up 7.4%. What has softened is volume: New York State closings were down 3.5% year over year in June 2026, with inventory up 2.7%. Slower selling is not the same as falling prices.
Why is the City of Rochester median so much lower than the metro median?
Because they are different geographies with different housing stock. The city figure, $181,000 at the close of Q2 2026 from GRAR data, covers only homes inside city limits. The metro figure of $252,800 includes Pittsford, Brighton, Mendon, Victor and the rest of the surrounding towns, where homes are generally larger and newer. Always confirm which boundary a number describes.
Can I trust the housing statistics on national listing websites?
Verify the date and the geography before you use any of them. In late August 2026 one major site's Rush page was still showing August 2025 figures under current sounding language, and another site's Rush page described City of Rochester neighborhoods as if they were in the town. The reliable local sources are MLS derived figures from the Greater Rochester Association of Realtors and the NAR quarterly metro series.
What is the most recent settled data for Monroe County?
Closed sale data always lags. Monthly figures are typically published roughly ten to fifteen days after a month ends, so the most recent complete month is generally the one before last. Listing side data, such as the Monroe County median listing price of $319,900 recorded in May 2026, is current faster but reflects asking prices, not what buyers actually paid.
Talk it through with someone who has been in these houses
Rankings are a starting point for a conversation, not a pricing strategy. If you want to see the actual comparable sales behind your street, your town and your price band, and hear plainly what they mean for your offer or your list price, book a time with Khem Kadariya. Bring the headline that worried you. We will check it against the source together.
About this data
The figures in this post were compiled from publicly available sources including Zillow, Houzeo, Movoto, RochesterFirst and Redfin, along with other public market data. Real estate numbers change quickly, and these were accurate as of August 2026. For current figures on a specific home, street, or town, ask me directly rather than relying on a published average.
Keep reading
Buying After You Sell?
If your move involves buying as well as selling, the financing side is worth lining up early.
I recommend connecting with my preferred lending partner, Brian Haefner with Premium Mortgage Corporation.
Stay Connected With Khem
Looking for more Rochester real estate information, community updates and local insight?
Want to know what these numbers mean for your own move? contact Khem and we can look at your situation specifically.
Recent Posts







Khem Kadariya
Phone