
Rochester Median Sales Price $252,800: Why It Is Not a Drop
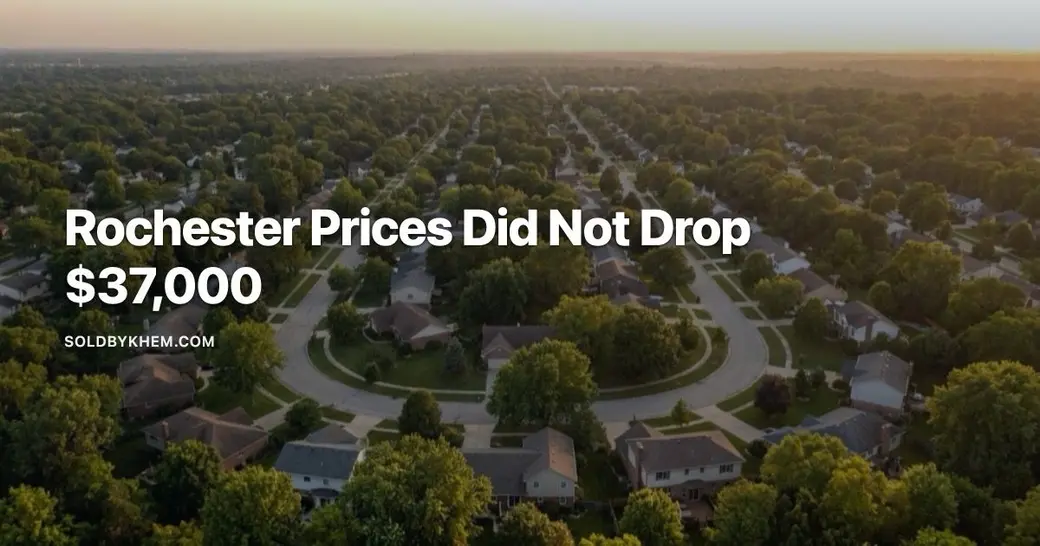
Is the Rochester housing market cooling in 2026?
Not according to the most recent quarterly figures. The Rochester metro median sales price was $252,800 in the first quarter of 2026, up 7.2% from the same quarter a year earlier and the 10th largest gain among the 235 largest US markets, per NAR data reported by the Rochester Business Journal.
Somebody sends me a screenshot about once a month. It shows the Rochester metro median sales price at $252,800, and next to it, a spring figure of $289,800. The conclusion in the text message is always the same: prices dropped $37,000, the market turned, should I wait.
They did not drop $37,000. The two numbers are not measuring the same thing, and stacking them side by side produces a false answer. This post walks through what each figure actually is, why quarterly medians move on a predictable calendar in this market, what the honest year over year comparison shows, and how to tell a live number from a stale one on the sites that keep republishing them.
What the two numbers actually are
Both come from the National Association of Realtors quarterly metro price report, covering the Rochester metro area. The Rochester Business Journal published the figures on May 7, 2026.
- Q2 2025 median sales price: $289,800
- Q3 2025 median sales price: $287,300
- Q1 2026 median sales price: $252,800, up 7.2% year over year
That last line is the one the screenshots always cut off. The first quarter of 2026 was up 7.2% compared to the first quarter of 2025. The RBJ reported it as the 10th largest increase among the 235 largest US markets tracked.
So the same dataset that produces a scary looking $37,000 gap also ranks Rochester near the top of the country for price growth. Both statements are true. Only one of them is a valid comparison.
Why does the Rochester metro median fall between spring and winter?
Because a first quarter median and a second quarter median are built from different houses. The RBJ article notes directly that Q1 is seasonally the weakest quarter for prices. That is not a Rochester quirk, but it is pronounced here.
Think about what closes in January, February and March in Monroe County. Contracts written in November and December. Estate sales and relocations that could not wait for spring. Homes that sat through the fall and finally came down in price. Fewer of them, and a different mix.
Now think about what closes in May, June and July. Contracts written in March and April, when the largest number of listings hit at once and the largest number of buyers are competing for them. Larger houses that owners deliberately held back until the yard looked like something. More move up transactions.
The median is just the middle sale. Change the pool of sales and you change the middle, even if not one house in Rush or Pittsford is worth a dollar less than it was in June. Seasonality in Rochester home prices is a mix effect first and a value effect somewhere far behind.
The comparison that actually means something
Compare the same quarter to itself a year earlier. Q1 to Q1. Q2 to Q2. That holds the season constant and lets the price signal come through.
| Quarter | Rochester metro median sales price | What it can be compared to |
|---|---|---|
| Q2 2025 | $289,800 | Q2 2024, Q2 2026 |
| Q3 2025 | $287,300 | Q3 2024, Q3 2026 |
| Q1 2026 | $252,800, up 7.2% year over year | Q1 2025, Q1 2027 |
Read down the middle column and you see a decline. Read the right hand column and you see the only defensible reading: the one apples to apples comparison available in this data shows prices up 7.2%.
One honest caveat. That NAR release covers the first quarter of 2026 and was published in May. Second quarter metro figures should exist by now. If you are reading this and someone quotes you a newer NAR quarter, use it, and apply the same rule to it.
Is the Rochester market cooling at all?
There are mild cooling signals statewide, and they are worth knowing, but they are not what the quarterly headline was showing you. Redfin's New York State figures for June 2026 put the statewide median sale price at $553,268, up 7.4% year over year, with 10,253 homes sold, down 3.5% from 10,628 a year earlier. Homes for sale were up 2.7%. Median days on market was 36, one day slower than a year before.
That is the picture of a market losing a little heat at the edges: slightly more to choose from, slightly fewer transactions, prices still climbing. It is a very different statement from prices falling.
Locally, the numbers that exist point the same direction. The Monroe County median listing price was $319,900 in May 2026, per the Realtor.com series carried on FRED. That is a list price, not a sale price, so it tells you what owners are asking, not what closed. At the close of Q2 2026, the City of Rochester median sale price was $181,000, reported by the Rochester Beacon on July 9, 2026 from Greater Rochester Association of Realtors statistics. The Beacon also traced the city median from roughly $102,000 in 2018 to $148,000 in 2024, a 45% increase.
Three different geographies, three different numbers, none of them interchangeable. The city is not the metro. The metro is not the county. A list price is not a sale price.
How to tell whether the number in front of you is real
Most of the confusion I see does not come from NAR or GRAR. It comes from aggregator pages that regenerate daily with whatever they have. A few things I found while pulling data for this post, offered as a field guide:
- Check whether the month has ended. Closed sale data for a month cannot be compiled until the month is over, and local reports typically publish roughly ten to fifteen days after that. A site showing you a closed median for the month you are standing in is showing you something else.
- Watch for stale data with a fresh date stamp. One national site's page for Rush, NY reported a median sale price of $330,000, down 24.6% year over year, with 10 days on market and five homes sold. Those were August 2025 figures presented under language that read like last month.
- Sanity check the figures against each other. One aggregator's July 2026 Rochester page showed homes selling at 120.57% of asking price and sitting 51 days on market at the same time. Those two cannot both describe one market. The same page showed sales up 78.6% while inventory fell 28.09%.
- Confirm the page knows where it is. A second site's page for Rush listed the town's neighborhoods as Park Avenue, Corn Hill, South Wedge and Beechwood. All are City of Rochester neighborhoods. None are in Rush.
- Beware the other Monroe. Searching Monroe County NY housing inventory will surface pages about the Town of Monroe in Orange County, near Harriman State Park. Nothing to do with Rochester.
What this changes if you are selling or buying
If you are selling, the seasonal pattern is an argument about timing, not about value. Spring quarters carry the highest medians in this metro because that is when the deepest pool of buyers and the largest houses meet. That does not mean a November listing is a mistake. It means you should expect fewer competing listings, fewer showings, and a buyer pool that is generally moving for a reason. Price to the comparable sales in your own town and price band, not to a metro wide median that includes everything from a city double to a Mendon acreage parcel.
If you are buying and you have been waiting for a correction that a headline promised you, look at what the underlying data says. Up 7.2% year over year, tenth largest gain in the country's 235 largest markets. Affordability pressure here is real: Census Bureau data reported by the Rochester Beacon shows 50.9% of Rochester renters were cost burdened in 2024 and 24.7% of homeowners, more than 38,000 households in total, though both figures are down from 57.9% and 25.8% in 2015. Pressure on budgets is not the same as prices about to fall.
Common questions
Why is the Rochester metro median different from the City of Rochester median?
They cover different geography. The metro area includes Monroe County plus surrounding counties and every town in them, so the sales pool runs from small city homes to large suburban and rural properties. The city figure covers only sales inside city limits. At the close of Q2 2026 the city median sale price was $181,000 per GRAR statistics reported by the Rochester Beacon, while the metro median for Q1 2026 was $252,800 per NAR. Neither is wrong. They are answering different questions.
Can I compare a median listing price to a median sale price?
No. A median listing price, such as the $319,900 recorded for Monroe County in May 2026 on the Realtor.com series carried by FRED, measures what sellers are asking on homes currently available. A median sale price measures what buyers actually paid on homes that closed. Asking prices reflect optimism and current inventory mix; sale prices reflect completed negotiations from contracts often signed a month or two earlier.
What is the best single indicator that the Rochester market is changing direction?
Same quarter year over year price change, read alongside days on market and active inventory from the same source. One number in isolation will mislead you. If the year over year median flattens while days on market lengthens and active listings rise across two or three consecutive reporting periods, that is a direction change. A single quarter to quarter move on the calendar is almost always the season.
Should I wait for prices to drop before buying in Henrietta or Pittsford?
The most recent quarterly data available shows the metro median rising, not falling, so waiting on a decline is a bet against what the numbers currently say. Small towns like Rush post such thin monthly volume, sometimes five or six sales, that town level medians swing wildly for reasons that have nothing to do with values. Judge a specific price band in a specific town against recent comparable closed sales, not against a metro or state headline.
If you want the actual comparable sales for your street and your price range, rather than a national aggregator's guess at them, book a time with me and we will go through them line by line.
Khem Kadariya
About this data
The figures in this post were compiled from publicly available sources including Zillow, Houzeo, Movoto, RochesterFirst and Redfin, along with other public market data. Real estate numbers change quickly, and these were accurate as of August 2026. For current figures on a specific home, street, or town, ask me directly rather than relying on a published average.
Keep reading
Buying After You Sell?
If your move involves buying as well as selling, the financing side is worth lining up early.
I recommend connecting with my preferred lending partner, Brian Haefner with Premium Mortgage Corporation.
Stay Connected With Khem
Looking for more Rochester real estate information, community updates and local insight?
- the Rochester market snapshot
- browse current Rochester listings
- see more Rochester content on Instagram
Want to know what these numbers mean for your own move? contact Khem and we can look at your situation specifically.
Recent Posts







Khem Kadariya
Phone