
Which Rochester Suburb Fits You: Henrietta, Pittsford, Brighton
Why are the median home prices for Pittsford NY that I see on Redfin, Movoto and other sites so different from each other?
Because town-level samples are tiny and the sites measure different things. Redfin reported a Pittsford median sale price of $450,000 for December 2025, down 38.6% year over year, but that was based on only three homes sold, so the swing is statistical noise. Movoto showed a July 2026 median list price of $549,000 at $214 per square foot with 9 days on market and a July 2025 median of $437,400 across 98 sales, while another site published $910,000 as both median home value and average sale price, two different metrics that cannot share one number. For reliable figures, use the Greater Rochester Association of Realtors monthly municipality-level report or a direct MLS pull.
If you are relocating to the Rochester area and trying to pick a town before you pick a house, this post is the ground floor. I will cover three things: what the verified market data does and does not tell you, how the housing stock differs between Henrietta, Pittsford, Brighton, Penfield and Webster, and how road access varies across those five towns.
I will also be direct about something most comparison articles hide. Reliable, town-level sale price data for Monroe County is not sitting on a public website. The numbers you find on the big aggregator sites are frequently wrong, and I will show you exactly how wrong with a real example. Everything numeric below is attributed to a named source with its reporting period. Where I do not have a verified number, I say so instead of filling the gap.
Start With the Numbers That Are Actually Solid
Two figures apply no matter which town you choose.
First, financing. Freddie Mac's Primary Mortgage Market Survey put the 30-year fixed rate at 6.65% on August 20, 2026, against 6.58% a year earlier. The 15-year sat at 5.95%. That is a seven basis point move over twelve months. Rates are effectively flat, so if you are waiting for a rate event to change your budget, nothing in the recent data suggests one arrived. Worth noting: PMMS measures conventional, conforming loans with 20% down and excellent credit. Your quote may differ.
Second, price direction across the metro. The National Association of Realtors, reported by the Rochester Business Journal on May 7, 2026, put the Rochester metro median sales price at $252,800 in Q1 2026, up 7.2% year over year. That was the tenth largest first quarter increase among the nation's 235 largest markets. The same reporting listed a Q2 2025 median of $289,800 and a Q3 2025 median of $287,300, which tells you Q1 is seasonally the weakest quarter here. Do not read a Q1 figure as a decline.
Supply is the constraint. A regional figure of 0.52 months of inventory in December 2025 was reported by Team Hilbert citing RPR, against the 5 to 6 months that defines a balanced market. Houzeo's city of Rochester page reported 0.33 months of supply in July 2026, down from 0.79 a year prior. Different geographies, same message: there is very little to buy.
Why Town-Level Price Stats Online Are Unreliable
Here is the example. Redfin reported a Pittsford median sale price of $450,000 for December 2025, down 38.6% year over year. That figure was based on three homes sold. Three. A 38.6% swing off a three-sale month is statistical noise, not a market signal, and it is precisely the kind of number that produces a panicked headline.
For the same town, Movoto showed a July 2026 median list price of $549,000 at $214 per square foot with 9 days on market, and separately a July 2025 median of $437,400 across 98 sales. Another site published $910,000 as both the median home value and the average sale price, which are two different metrics and cannot share one number. Four sources, four irreconcilable answers, one town.
It gets worse in the city data. Houzeo's July 2026 page for the city of Rochester reported 51 median days on market alongside a 120.57% sale-to-list ratio and 88.83% of homes selling above asking. A market where nine in ten homes clear above list at twenty percent over does not also take 51 days to sell. Those numbers contradict each other on a single screen.
So when you search best Rochester NY suburbs or run a Rochester suburbs comparison and land on a page with a tidy median for each town, treat it as a rough gesture. The fix is municipality-level data from the Greater Rochester Association of Realtors monthly report or a direct MLS pull, which is what I use when a client asks what a specific town is actually doing.
Housing Stock, Town by Town
This part I can speak to from walking the houses, and it is often the deciding factor once budgets are close.
- Henrietta and West Henrietta. The widest range of construction eras and price points of the five. Mid-century ranches and split levels dominate large stretches, with pockets of newer subdivision colonials and a meaningful supply of townhouses and condominiums. West Henrietta runs more rural as you move south, with larger parcels and older farmhouses mixed in. If you want a single-story floor plan or an attached garage on a flat lot, you will find more candidates here.
- Brighton. Older, denser, more architecturally varied. Prewar and postwar colonials, tudors and capes on tighter lots, many with original woodwork and finished attics, plus a stock of mid-century contemporaries. Sidewalks in much of the town. Basements and mechanical systems deserve close attention at this age, and you should expect to price in updates on windows, wiring and heating on a fair number of listings.
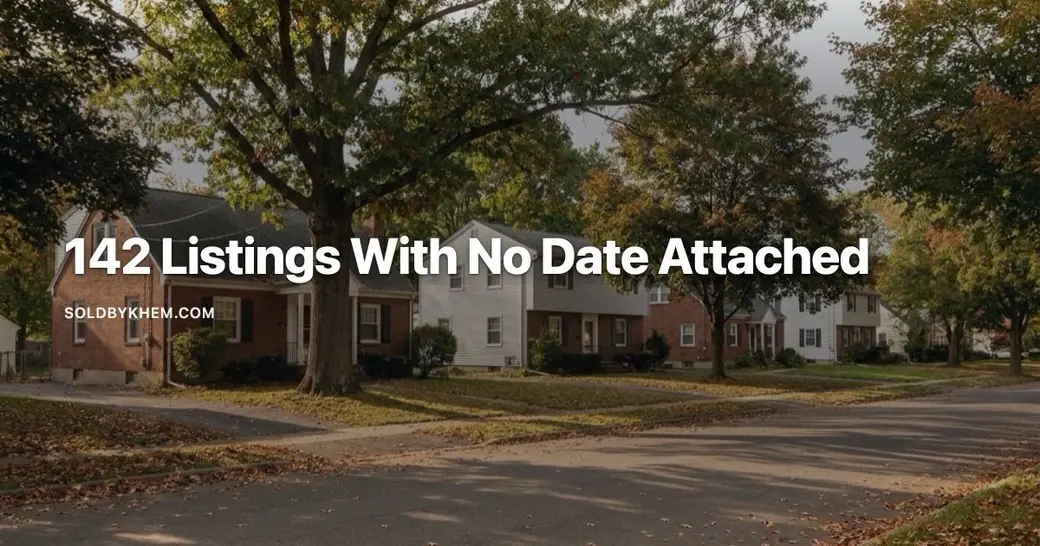
- Pittsford. Two distinct markets that get averaged together and should not be. Village properties are older and closer set, some of them small and quite old. Outside the village you get large-lot subdivision homes from the 1970s through today, including newer builds with the square footage and layouts buyers relocating from other metros usually expect. That split is one reason Pittsford medians bounce around so much.
- Penfield. Heavier on 1980s through 2010s subdivision construction, with older hamlet housing around Four Corners and rural parcels toward the eastern edge. Generally newer mechanicals than Brighton, generally more yard than Brighton, and more variety in lot size than a single subdivision suggests.
- Webster. The most new and newer construction of the five, including active development, plus older housing near the village and a distinct segment of properties toward Lake Ontario. If you want a build from the last twenty years without a custom project, this is where inventory tends to show up.
Road Access and School Districts
I do not have verified commute time data for these towns. Census ACS travel time tables exist and I will not paraphrase them from memory. What I can give you is geography, which you can test yourself by driving your actual route at your actual departure time before you write an offer. Do that. It settles the question better than any average.
| Town | Primary road access | District covering most of the town | Housing stock you see most |
|---|---|---|---|
| Henrietta / West Henrietta | I-390, NYS Thruway, Route 15 | Rush-Henrietta Central | Ranches, split levels, townhouses |
| Brighton | I-590, I-490, Monroe Ave | Brighton Central | Older colonials, capes, tudors |
| Pittsford | I-490, Routes 31 and 96 | Pittsford Central | Village older stock plus large-lot subdivisions |
| Penfield | I-490, Routes 441 and 250 | Penfield Central | 1980s to 2010s subdivisions |
| Webster | Route 104, I-590 | Webster Central | Newer construction plus village housing |
Two cautions on that table. District boundaries do not follow town lines. Parts of Brighton, Henrietta and Penfield sit in neighboring districts, so verify the district by street address, not by town. And I have no verified property tax rates for any of these towns, which matters because they differ materially. Pull the current rate for a specific parcel from the Monroe County Real Property Portal before you compare monthly payments across towns.
How to Narrow It Down
People search best suburbs for families Rochester NY and Pittsford vs Brighton vs Penfield expecting a ranking. I will not write one. I describe houses, streets, road access and numbers, not who belongs where, and any agent ranking towns by who lives in them is doing something they should not.
Here is what I would do in your position. Pick the two construction eras you can live with, because that decides more of your monthly cost than the town name does. Drive your commute route twice. Pull tax rates on three specific addresses. Then, and only then, compare price, using real MLS numbers rather than an aggregator page that cannot keep its own figures straight.
With 0.33 months of supply reported in the city in July 2026 and roughly half a month regionally last December, the towns you rule out matter as much as the one you choose. Deciding late costs you houses.
If you want to talk through where to live near Rochester NY with someone who will show you the actual sold comps for each town and tell you plainly when the data is thin, book a time with me here. Bring your commute address and your budget and we will start there.
Khem Kadariya
About this data
The figures in this post were compiled from publicly available sources including Houzeo, Zillow, FRED (Federal Reserve Bank of St. Louis), Redfin and the Rochester Business Journal, along with other public market data. Real estate numbers change quickly, and these were accurate as of August 2026. For current figures on a specific home, street, or town, ask me directly rather than relying on a published average.
Keep reading
Need Help With Financing?
If you are moving to the Rochester area from out of state, it is worth getting the financing conversation started before you begin your home search, so you know what you are working with when the right house appears.
I recommend connecting with my preferred lending partner, Brian Haefner with Premium Mortgage Corporation. Whether you are a first-time homebuyer, relocating to the Rochester area, purchasing your next home, or simply want to understand your mortgage options and buying power, Brian can help you explore your financing options and answer your mortgage-related questions.
Stay Connected With Khem
Looking for more Rochester real estate information, community updates and local insight?
- current Rochester market numbers
- search Rochester homes for sale
- see more Rochester content on Instagram
Want to know what these numbers mean for your own move? contact Khem and we can look at your situation specifically.
Recent Posts




Khem Kadariya
Phone