
Penfield NY Home Data: Why City Neighborhoods Show Up
Can I trust the Penfield NY median home price numbers I see on Movoto, Redfin and RealtyTrac?
Not without checking the date on each figure. As of August 2026, Movoto showed a Penfield median list price of $374K for July 2026 and 9 median days on market, but Redfin's median sale price of $382K (down 8.7% year over year) and price per square foot of $211 were both from May 2025, making them 15 months old on a live page. RealtyTrac listed a median estimated value of $323,330 with no date at all and included an impossible claim that 275.00% of properties in the city are for sale, so that source should be discarded.
If you are researching Rochester from Charlotte or Chicago or Brooklyn, you have probably typed a town name into a national real estate site and started reading. That is a reasonable thing to do. It is also where a specific and repeatable error creeps in.
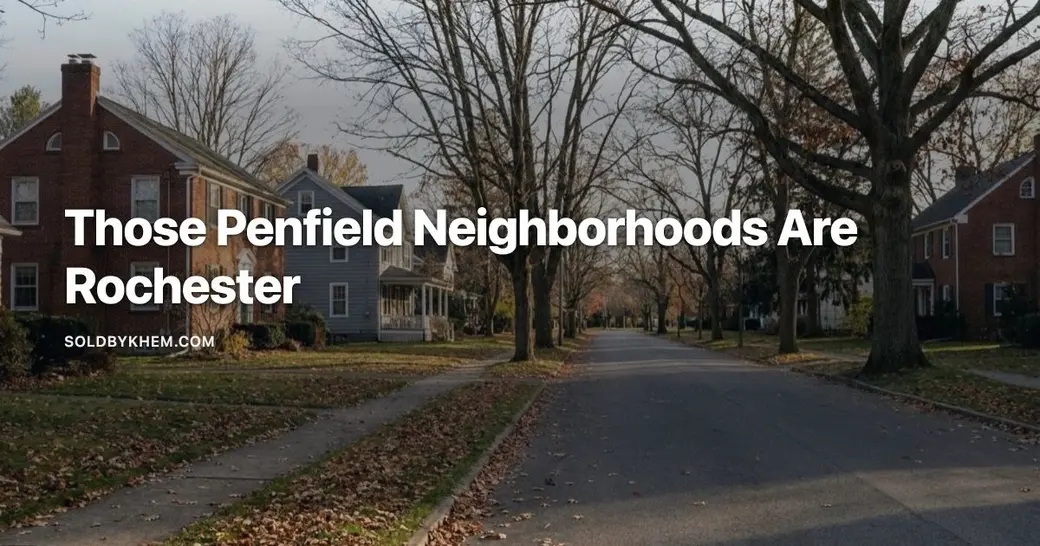
Search for Penfield neighborhoods on Movoto and the site returns Corn Hill, the South Wedge, Park Avenue and Beechwood. Every one of those is inside the City of Rochester. Penfield is a separate town, roughly a fifteen minute drive northeast, with its own tax roll, its own school district and its own housing stock. The list is simply wrong.
This post covers three things: why that mix-up happens, what else it quietly breaks on the same pages, and a checklist for verifying any Rochester-area number before you act on it. I sell in south and southeast Monroe County, not Penfield, so I have no stake in how Penfield looks. I am using it because it is the cleanest example of the problem I have found.
Why does Movoto show Rochester city listings for Penfield NY?
The neighborhood list is the visible symptom. Movoto's Penfield page surfaces city neighborhoods under a suburban town heading. Anyone who has driven from Penfield Four Corners to the South Wedge knows those are not the same market, not the same era of construction, and not the same price per square foot.
Here is the part that matters for a buyer. If the geography feeding the neighborhood module is contaminated with city data, you cannot assume the geography feeding the price module is clean. Maybe it is. Maybe it is not. You have no way to check from the outside, and the site does not tell you what its Penfield boundary is.
That is the whole problem with Rochester neighborhood data errors on national platforms. They are not usually loud. A list of the wrong neighborhoods is loud. A median price built on a slightly wrong polygon just looks like a number.
Why do home value sites get Monroe County NY boundaries wrong?
Rochester's mailing addresses do not respect municipal lines. Plenty of homes carry a Rochester, NY mailing address while sitting in Brighton, Henrietta or Greece. School district boundaries cut across town lines. ZIP codes cut across both. An automated system stitching together listing feeds, tax records and ZIP-level census data has to pick one of those frameworks, and whichever it picks will disagree with the other two somewhere.
Now layer on the suburban versus city housing data gap in this market. The two are genuinely different products:
- City housing stock skews older and smaller, with different lot sizes and a different mix of two-family properties.
- Suburban towns carry their own tax rates and their own school districts, and Penfield's district is Penfield Central School District.
- Price per square foot diverges sharply between the two. That divergence is exactly what gets flattened when a boundary is wrong.
So when a site blends even a small slice of city inventory into a suburban town average, the number moves. You will not see it move. You will just see a number.
How outdated is Penfield NY home data on aggregator sites?
Boundary errors are at least theoretically detectable. Stale data is harder, because a page with old numbers looks identical to a page with current ones.
When I went looking for a current Penfield median sale price in August 2026, here is what was actually available:
| Figure | Value | Period | Source |
|---|---|---|---|
| Median list price | $374K | July 2026 | Movoto |
| Median list price | $377K | April 2026 | Movoto |
| Median days on market | 9 days, flat vs July 2025 | July 2026 | Movoto |
| Median sale price | $382K, down 8.7% year over year | May 2025 | Redfin |
| Price per square foot | $211, down 3.0% year over year | May 2025 | Redfin |
| Median estimated value | $323,330 | Undated | RealtyTrac |
Read that table slowly. The Redfin sale price and price per square foot were, as of August 2026, fifteen months old. They were displayed on a live page. Nothing on the page shouts that.
Worse, that stale figure shows an 8.7% year-over-year decline. If you land on it cold, you conclude Penfield is falling. What you have actually learned is what happened in May 2025.
The RealtyTrac page is a different failure. It carries no date at all, and its own text at one point states that the percentage of properties for sale in the city is 275.00%, which is not a possible number. I discarded that page entirely and you should too.
What does a contradictory Penfield NY median price tell you?
My favorite tell is internal contradiction, because it requires no local knowledge to catch. Somewhere in the pile of Rochester market pages I reviewed sits a claim that homes here sell at 120.57% of asking price with a median of 51 days on market.
Those two things cannot both be true of the same market at the same time. Homes that draw twenty percent over asking are not sitting for seven weeks. Bidding pressure that intense resolves in days. When you see a stat pair like that, you are not looking at a market, you are looking at two different data pulls that got stapled together.
For comparison, Zillow had Rochester homes going pending in roughly 8 days as of its 6/30/2026 update, and Movoto had Penfield at 9 median days on market in July 2026. Two independent sources, same ballpark. The 51-day figure is the outlier, and outliers that arrive attached to an impossible companion stat are not worth your time.
What Penfield NY home data can I actually verify?
Being straight with you about the limits here matters more than sounding authoritative.
Verified and current: the 30-year fixed averaged 6.67% for the week of August 13, 2026, per Freddie Mac's Primary Mortgage Market Survey, against 6.58% a year earlier. That is nine basis points of movement over twelve months. Essentially flat. Rates are not the thing moving Rochester prices right now, in either direction.
Verified at the county level: Monroe County's median sale price was $308,500 in May 2026, reported as a new high, per NYSAR data cited by the Rochester Business Journal on June 26, 2026. Separately, FRED's Realtor.com series put the Monroe County median listing price at $319,900 for May 2026. Those are two different measurements, closed sales versus current asking prices, and they should never be used interchangeably.
Not verified: a current 2026 Penfield median sale price. A current Penfield price per square foot. A reliable Penfield active listing count. I could not source any of them, so I am not going to hand you one.
Also worth knowing: Realtor.com ranked Rochester the #2 U.S. housing market for 2026 in a forecast published December 2025, projecting 5.3% sales growth and 10.3% median sale price growth. That report noted roughly 40% of listing views came from out of state. That is a forecast, not a result. But it does tell you something about who else is reading the same pages you are.
How do I verify Penfield NY home prices before visiting?
A working checklist:
- Find the date on every number. If a page will not tell you the reporting month, treat the figure as unusable. Not suspect. Unusable.
- Check whether it is a sale price or a list price. Asking prices tell you what sellers hope for. Closed sales tell you what buyers paid. In Monroe County in May 2026 those two figures sat about $11,000 apart.
- Test the page's geography. Look at the neighborhood list, the sample listings, the photos. If a suburban town page is showing you city neighborhoods, distrust the whole page.
- Look for a self-contradiction. Percent of asking and days on market should tell the same story. So should inventory direction and price direction.
- Compare across at least two sources. Agreement is not proof, but disagreement is a signal to dig.
- Ask for closed comparable sales on specific streets. Town-level medians blend a 1958 ranch with a 2019 build. Your decision is about one house.
What actually settles it
No public site covers Henrietta, West Henrietta, Pittsford, Brighton, Mendon, Rush or Honeoye Falls with anything close to the precision a relocating buyer needs. I have looked. The town-level data either does not exist publicly, is stale, or is built on a boundary nobody will show you.
What does exist is the MLS, plus the closed sale records behind it, plus knowing that a particular street in Henrietta backs onto a different situation than the street one over. That last part does not come from a database. I have walked these houses. I spent years buying and rehabbing property here before I sold it for other people, which means I read a comp sheet the way an investor does: what condition was that house in when it closed, and does it actually compare to this one.
If you are researching from out of state and want a real number for a specific town or a specific street, I will pull the comparable sales and walk you through what they mean, including the ones that undercut whatever you were hoping to hear.
Schedule a time with Khem Kadariya and bring the pages that confused you. We will go through them line by line.
About this data
The figures in this post were compiled from publicly available sources including Houzeo, Zillow, RochesterFirst, the Rochester Business Journal and FRED (Federal Reserve Bank of St. Louis), along with other public market data. Real estate numbers change quickly, and these were accurate as of August 2026. For current figures on a specific home, street, or town, ask me directly rather than relying on a published average.
Keep reading
Need Help With Financing?
Thinking about buying a home and wondering what financing options may be available to you?
I recommend connecting with my preferred lending partner, Brian Haefner with Premium Mortgage Corporation. Whether you are a first-time homebuyer, relocating to the Rochester area, purchasing your next home, or simply want to understand your mortgage options and buying power, Brian can help you explore your financing options and answer your mortgage-related questions.
Stay Connected With Khem
Looking for more Rochester real estate information, community updates and local insight?
Have a question about Rochester real estate? contact Khem and we can talk it through.
Recent Posts








Khem Kadariya
Phone