
List Your Brighton Home This Fall or Hold Until Spring?
Are mortgage rates expected to drop enough by spring 2026 to make waiting to sell my Brighton NY house worthwhile?
Nothing in the current data supports that bet. Freddie Mac's 30-year fixed averaged 6.65% for the week ending August 20, 2026, after 6.67% on August 13 and 6.69% on August 6, and it was 6.58% the same week in 2025, a year-over-year gap of just seven basis points. The 15-year fixed was 5.96% for the week ending August 13, 2026, versus 5.71% a year earlier. That is noise, not a trend, so building a six-month plan around lower rates is a gamble.
You are weighing two options: put your Brighton house on the market in the next sixty days, or sit tight until March. This post lays out the three data points people keep citing when they ask me about it, tells you how solid each one is, and separates the parts of the decision that data can settle from the parts it cannot. I will also name the figures floating around online that I will not repeat, and why.
Should I wait for mortgage rates to drop in Rochester NY?
Freddie Mac's Primary Mortgage Market Survey put the 30-year fixed rate at 6.65% for the week ending August 20, 2026. That followed 6.67% the week ending August 13 and 6.69% the week ending August 6. The same week a year earlier, in 2025, the 30-year averaged 6.58%. The 15-year fixed averaged 5.96% for the week ending August 13, 2026, compared with 5.71% a year earlier.
Read that year-over-year gap again: seven basis points on the 30-year. That is not a trend. That is noise. If your plan is to hold until spring because rates will be better, you are betting on a move that nothing in the current data promises. Rates could drift down. They could drift up. Neither the August readings nor their year-ago comparisons give you a reason to build a six-month plan around it.
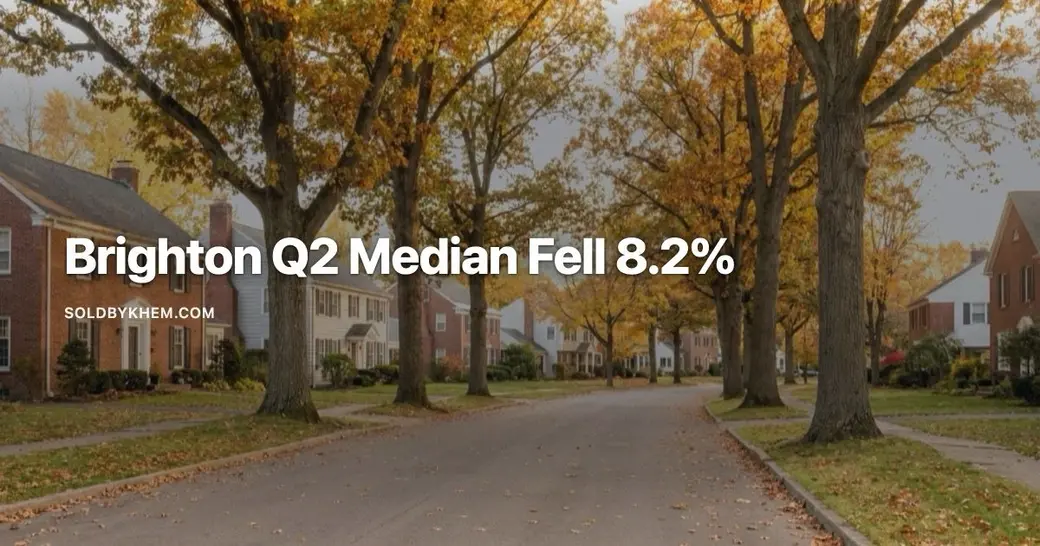
Did Brighton NY median home prices fall in Q2?
The one genuinely Brighton-specific number I can put in front of you is a quarterly recap covering April through June.
| Brighton, NY | Q2 2026 | Q2 2025 | Change |
|---|---|---|---|
| Median sale price | $424,150 | $462,170 | Down 8.2% |
| Average sale price | $482,700 | $504,350 | Down 4.3% |
Three honest caveats before you react to that. First, this comes from a brokerage's quarterly market recap, not an MLS-verified release, so I treat it as directional rather than final. Second, Q2 means April, May and June. It tells you nothing about July, August or what a fall listing would face. Third, a town the size of Brighton closes a modest number of sales in a quarter, and a handful of higher-priced or lower-priced transactions can move a median several percent without the underlying market changing at all.
Notice also that the average fell less than the median. When those two diverge, it usually says something about the mix of what sold rather than about values across the board. Fewer sales in one price band, more in another, and the median shifts. That is a different situation from every house in Brighton being worth 8% less than last year, and I would not let anyone tell you those are the same thing.
Are Monroe County home prices asking prices or sold prices?
Here is where people get tripped up. The Monroe County figure most often quoted, $319,900 for May 2026, comes from the Realtor.com series carried on FRED, and it is a median listing price. That is what sellers asked, not what buyers paid. The Rochester metro median listing price per square foot was $184 in June 2026, same caveat.
Zillow's modeled average home value for Monroe County was $285,439, up 4.1% year over year, and it showed homes going pending in roughly 8 days. Both of those carry an update date of April 30, 2026. That is four months stale as of this writing.
The 8-day pending pace is still the most useful thing in that paragraph, because it describes a mechanism rather than a price. Even if it has slowed since April, a market where prepared listings get decided in days behaves differently from one where they sit. It means the first ten days of exposure carry most of the weight. It means pricing errors surface fast. And it means a shorter fall selling window is less of a handicap than it would be in a market where buyers take two months to move.
Why do online Brighton NY home price numbers disagree?
For the City of Rochester in July 2026, three aggregators published three different median sale prices for the same city in the same month.
| Source | July 2026 median sale price | Days on market | Homes sold |
|---|---|---|---|
| Aggregator A | $230,000, up 17.95% year over year | 51 days | 509, up 78.6% |
| Aggregator B | $199,000 | 13 days | 643 |
| Aggregator C | $255,000 | Not published | Not published |
That is a $56,000 spread and a nearly fourfold gap in days on market for one city, one month. Aggregator B's own page states 643 homes sold,
About this data
The figures in this post were compiled from publicly available sources including Houzeo, Movoto, Zillow, FRED (Federal Reserve Bank of St. Louis) and Redfin, along with other public market data. Real estate numbers change quickly, and these were accurate as of August 2026. For current figures on a specific home, street, or town, ask me directly rather than relying on a published average.
Keep reading
Need Help With Financing?
Thinking about buying a home and wondering what financing options may be available to you?
I recommend connecting with my preferred lending partner, Brian Haefner with Premium Mortgage Corporation. Whether you are a first-time homebuyer, relocating to the Rochester area, purchasing your next home, or simply want to understand your mortgage options and buying power, Brian can help you explore your financing options and answer your mortgage-related questions.
Stay Connected With Khem
Looking for more Rochester real estate information, community updates and local insight?
- browse current Rochester listings
- Khem's guide to relocating to Rochester
- see more Rochester content on Instagram
Have a question about Rochester real estate? contact Khem and we can talk it through.
Recent Posts







Khem Kadariya
Phone